King of Weighted Calisthenics: A statistical analysis
Some visualization and statistical analysis of the King of Calisthenics competition
In this post, we make a first step toward organizing, analyzing and interpreting calisthenics related data. We also show how to use these data to set calisthenics goals.
We hope this analysis will help the interested practitioner in their calisthenics journey, as it will set baselines that he or she can compare against.
While we intend to help calisthenics practitioners train in an efficient and effective way by making available some useful numbers, data analysis comes with a good share of caution.
First, the context: data from which the analysis is built upon come from a weighted calisthenics competition. Second, for all computed average values, the reader must always keep in mind that some standard deviation
The forthcoming numbers should be taken in context and will never be a replacement for a (as) complete (as possible) understanding of the needs of the calisthenics practitioner.
Shall we not be deluded by sheer and raw numbers, we can certainly make good use of them!
I will use the data to show that I am roughly halfway from being average ¯\_(ツ)_/¯.
Weighted calisthenics
In 2022 was held the season 1 of the King of Weighted Calisthenics competition, an international and internet based event organized by Micha Schulz.
Each participant had to get their weighted equipment and record their 1RM
One-repetition maximum: https://en.wikipedia.org/wiki/One-repetition_maximum attempts for dips, pull-ups and squats according to some specified rules (especially regarding the range of motion).
Similarly to gymnastics, rock climbing and other bodyweight related sports, calisthenics emphasizes on the strength to bodyweight ratio and tends to fade in the performances of the best athletes across different weight classes. However, in weighted calisthenics, ones has to lift the additional weight that is attached to one’s body. On one hand, tt seems like the heavier the athlete, the heavier the 1RM additional weight: the absolute strength increases with the athlete’s bodyweight. On the other hand, can we say the same thing about the relative strength? How does the added percentage of athlete’s bodyweight increase with the athlete’s bodyweight?
Let’s find out by analyzing the data!
The data
The first step is to gather and organize the data in a table and check for incoherent values. Because the competition is international, organizers have to take into account both the imperial and metric system. The metric system is used: heights are measured in meters and weights in kilograms.
Let’s get a glimpse of the raw data before making them more useful and meaningful.
| Athlete number | height (m) | bodyweight (kg) | dip (kg) | pull-up (kg) | squat (kg) |
|---|---|---|---|---|---|
| 0 | 1.8 | 95.5 | 160 | 105 | 232.5 |
| 1 | 1.94 | 108.5 | 155 | 100 | 240 |
| 2 | 1.83 | 91.6 | 150 | 85 | 236.25 |
| 3 | 1.83 | 90 | 145 | 110 | 212.5 |
| 4 | 1.74 | 82.4 | 130 | 72.5 | 242.5 |
| 5 | 1.8 | 89.8 | 130 | 90 | 225 |
| 6 | 1.75 | 86.7 | 120 | 80 | 242.5 |
| \(\cdots\) | \(\cdots\) | \(\cdots\) | \(\cdots\) | \(\cdots\) | \(\cdots\) |
| 143 | 1.65 | 72.8 | 120 | 70 | 190 |
| 144 | 1.78 | 73.9 | 65.7 | 52.1 | 165.5 |
| 145 | 1.86 | 109 | 200 | 120 | 185 |
| 146 | 1.8 | 67 | 60 | 50 | 90 |
| 147 | 1.8 | 82.7 | 145 | 95 | 195 |
| 148 | 1.85 | 70.1 | 50 | 32 | 110 |
| 149 | 1.8 | 68.9 | 50 | 55 | 120 |
In the table, one can see that some weights have a residual .1 kg or .7 kg. It seems like a result of the conversion from the imperial system to the metric system. Therefore, one can see that athlete number 144 is likely an american one. Even in an anonymized database, one must be careful about private informations that can be extracted from it!
After this digression on data confidentiality, let’s dive into the analysis!
Athletes profiles
What does the average participant look like?
| height (m) | bodyweight (kg) | dip (kg) | pull-up (kg) | squat (kg) |
|---|---|---|---|---|
| 1.76 | 77 | 81.5 | 57 | 144 |
An athletic human being indeed!
Please be aware that, while very few female athletes, there are both male and females athletes in the dataset. Despite our dataset being built only on the participants (thus biased toward their specific characteristics), we can remark that world average male height is 1.77 m, comparable to our computed 1.76 m.
The magnitude of the difference may be explained by the fact that we only considered calisthenics athletes, or by the fact that our dataset included female athletes, but this magnitude falls within the statistical uncertainty of our sample size (of order 0.01 m, i.e. 1 cm). Therefore, we cannot really comment on this difference in any meaningful way.
We hope this small example will help the reader to keep exercising statistical caution while going through the rest of this post.
While averages are interesting, histograms may be more informative.
What does the height distribution look like?
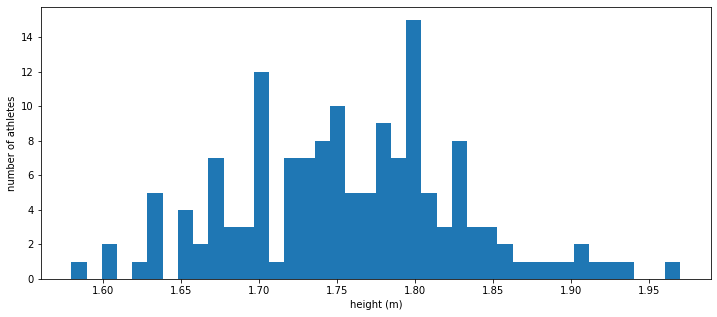
From a statistician viewpoint, the dataset is a bit small (150 used profiles) and is bound to be a bit noisy but one can spot two to three spikes in the histogram, indicating that there may be (at least) two to three larger groups of athletes coming from two to three differents parts of the world where the average (male) heights are differents.
What does the weight distribution look like?

Looking at the weight distribution of the athletes, one can spot something that is a bit odd: two major discontinuities at 73 kg and 83 kg. This is the effect of the competition rules! Indeed, there were three weight classes, strictly less than 73 kg (< 73), between 73 kg and 83 kg (73 - 83), and stricly more than 83 kg (> 83). This rule really shows in the weight distribution, in particular close to the 73 kg threshold.
It seems that many athletes tried really hard to get below the 73 kg threshold. Therefore, perhaps to the contrary of what some athletes initially tought, on may imagine that the competition must have been fierced in the less than 73 kg category. Analyzing the data, one can see that athletes between 72 kg and 73 kg are on average as strong (absolute strength) as the average lifter in the 73-83 category. An anomaly
However, seeing how the best athletes in the 73-83 categories have been able to lift a heavier total than the best < 73 athlete, it certainly has been a good decision for athletes close to the 73 kg threshold.
Other strategic statements might be analyzed from the data, but this is a topic for another post.
To wrap up this profiling section, let’s look at the correlation between the height and weight of athletes.
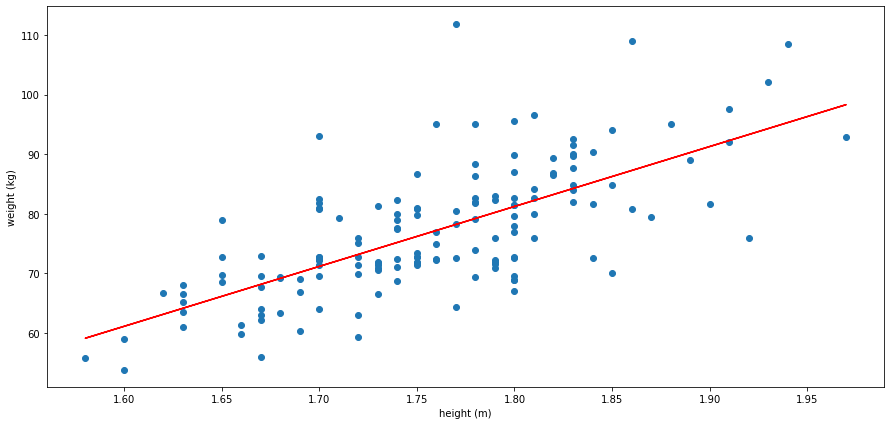
While there are some outliers
For concision, one can summarize all the previous informations into one plot.
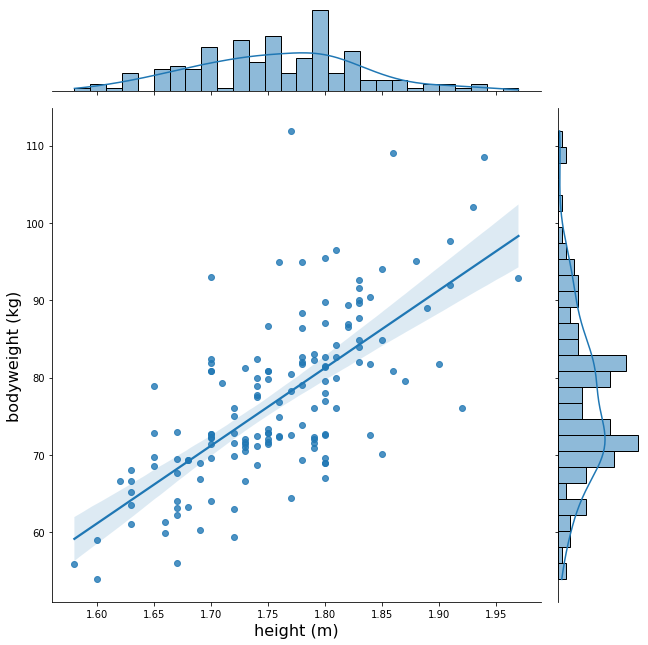
The regression line shows that on average, the athlete’s bodyweight increases of 1 kg per 1 cm of height. Of course, this is the result of a regression and the graph clearly shows the diversity of profiles, even at the same height, and a significant deviation around the mean.
On average, the taller the calisthenics athlete, the heavier. This was expected but it is still nice to confirm it with data and back up our knowledge.
The regression line allows us to compute, given the height of a calisthenics practitioner, its expected competitive bodyweight. This can constitute a first approximation of a fitness objective, but the practitioner should keep in mind the deviation around this expectation and that the dataset is built with athletes participating to a competition.
For me, whose height is 1.8 m, a reasonable weight computed from those data could therefore be around 81 kg. I am currently weigthing 72 kg, therefore below this landmark. However, I find this computed value a little bit high, especially compared to my other fitness objectives. At the end of this post, I will analyse some features of the athletes having a height of 1.8 m. In particular, we will see that the 1.8 m group has an average weight of 78 kg, which is, as far as I am concerned, a better target value. It seems to me that the computed regression line tends to overestimate the predicted weight. This is may be due to outliers like this one participant whose weight is 112 kg and whose height is 1.77 m.
We met the athletes, let’s see their performances!
Athletes performances
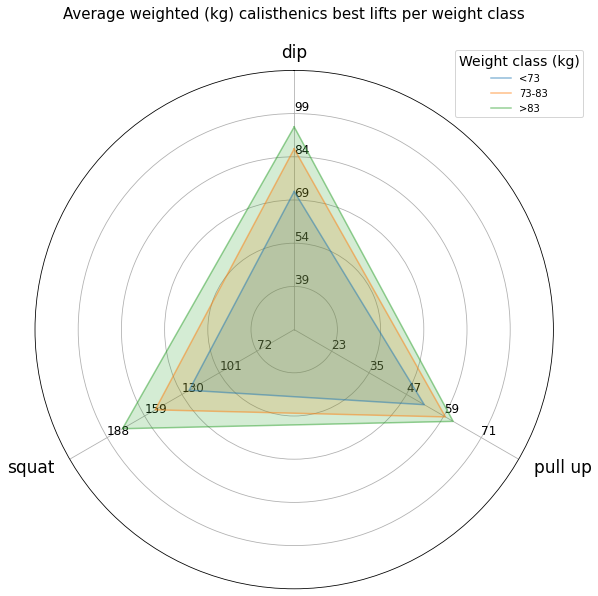
As a first step, we compute the average performances of the athletes for each weight class.
| weight class (kg) | nbr. of athletes | dip (kg) | pull-up (kg) | squat (kg) |
|---|---|---|---|---|
| < 73 | 70 | 72 | 52.7 | 124.4 |
| 73-83 | 45 | 86.8 | 59.5 | 150.7 |
| > 83 | 33 | 94.4 | 61 | 176.1 |
Remark: The total number of athletes, 70+45+33 = 148, is less than the 150 registered because we discarded two incoherent profiles. One of the discarded athlete was registered as 1 meter tall and the other as 5 meter tall.
It can be remarked that there are significantly more athletes in the < 73 kg category. For the next competition, I will kindly suggest to try to enforce more balanced weight classes. I do think that this would make the competition a bit fairer. I propose two solutions.
Another weight class can be created to make things a bit more even between the atletes of different categories. For instance, if the < 73 kg category were split into a < 70 kg and a 70-73 kg category, the first new one would have 38 participants and the second new one 32.
Of course, I understand that making three categories may be more appealing and that too small categories can create a lack of competition. Based on the current data, it would have been possible (a posteriori) to create the following three balanced weight classes:
- < 72 kg with 50 participants
- 72 - 81 kg with 49 participants
- > 81 kg with 49 participants
These two propositions can be merged together in effort to create four as-balanced-as-possible categories. It is interesting to note that other information can be used to set a criterion that define a fair weight division. For instance, one could want for the standard deviation of the weights within a weight class to be roughly the same in each class.
From an organizer standpoint, it is worth investigating the ways to create a fair weight division while taking into account that a participant may adapt their weight to the announced weight division. An irrealistic mathematician solution would be to announce the weight division after the participants registered.
Back to the analysis of the original weight division, one can visualize the previous table in the form of a radar chart
Absolute strength
The absolute strength refers to the the total amount of weight an athlete can lift, regardless of the athlete’s bodyweight.
Here we investigate, for each exercise, the relation between the added weight and the athlete’s bodyweight: Does the absolute strength increase with the athlete bodyweight?
Unsurprisingly, we find out that, indeed it does, thus justifying the fairness of implementing weight classes in the competiton’s rules.
Dip
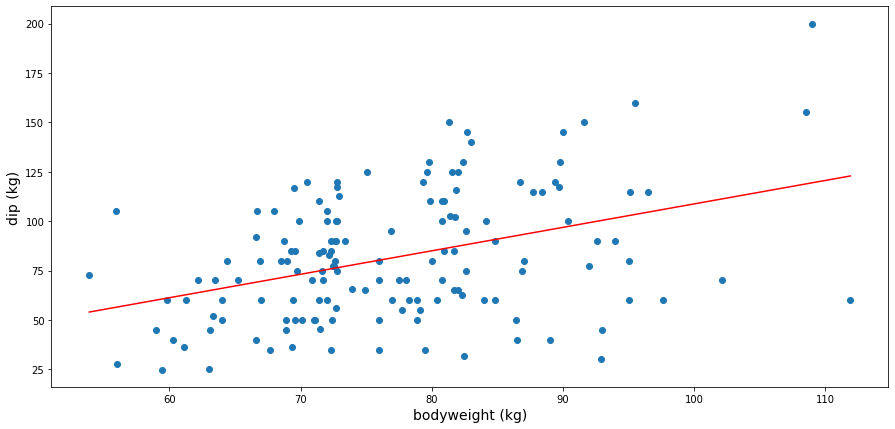
The regression line (in red on the graph) shows that the athlete can roughly add 1.19 kg of additional weight per additional bodyweight kg to its 1RM. Of course, this is the result of a regression and the graph clearly shows the diversity of profiles, even at the same weight, as well as a significant deviation around the mean.
This graph and regression line also show that, on average, the heavier the athlete’s bodyweight, the heavier the athlete’s lift. This was expected but it is still nice to confirm it with data and back up our knowledge.
The regression line allows us to compute, given the bodyweight of a calisthenics practitioner, its expected 1RM in the dip exercise. This can constitute a first approximation of a fitness objective, but the practitioner should keep in mind the deviation around this expectation and that the dataset is built with athletes participating to a competition.
For me, whose weight is 72 kg, a reasonable 1RM computed from those data could therefore be around 75 kg. It has been a few months since I tried weighted dips, but last time I tried, I sent 40 kg.
So yeah, halfway from being average ¯\_(ツ)_/¯.
Squat
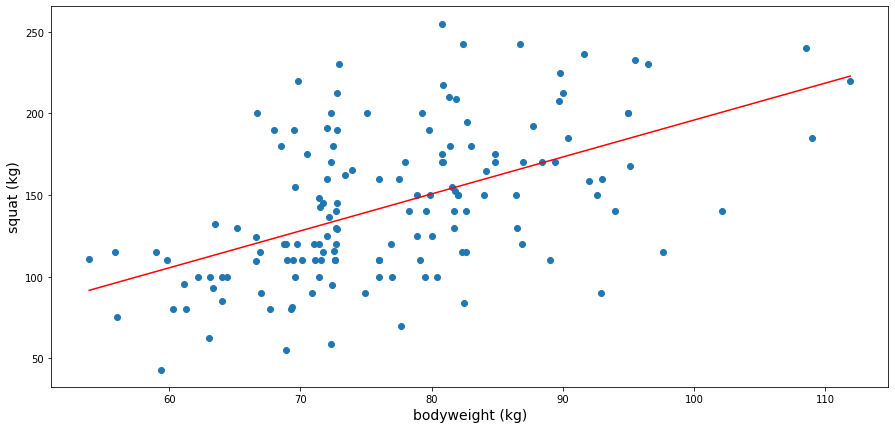
The regression line (in red on the graph) shows that the athlete can roughly add 2.26 kg of additional weight per additional bodyweight kg to its 1RM. Of course, this is the result of a regression and the graph clearly shows the diversity of profiles, even at the same weight, as well as a significant deviation around the mean.
As above, this graph and regression line also show that, on average, the heavier the athlete’s bodyweight, the heavier the athlete’s lift. Those numbers show that the athletes are indeed stronger, even in terms of progression, in the squat than the dip. This was also expected but it is still nice to confirm it with data and back up our knowledge.
The regression line allows us to compute, given the bodyweight of a calisthenics practitioner, its expected 1RM in the squat exercise. This can constitute a first approximation of a fitness objective, but the practitioner should keep in mind the deviation around this expectation and that the dataset is built with athletes participating to a competition.
For me, whose weight is 72 kg, a reasonable 1RM computed from those data could therefore be around 132 kg. Although I did a few squats with my girlfriend on my back, I never tried weighted squat so I cannot compare myself to this landmark.
To the best of my knowledge, I am again roughly halfway from being average ¯\_(ツ)_/¯.
pull-up
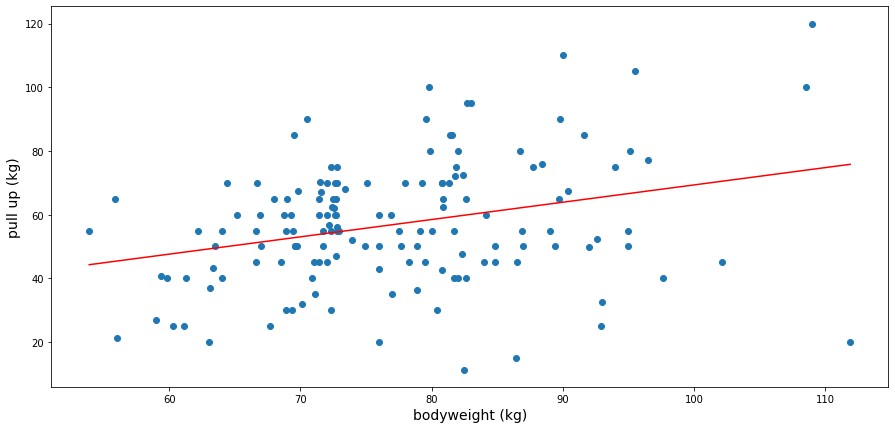
The regression line (in red on the graph) shows that the athlete can roughly add 0.54 kg of additional weight per additional bodyweight kg to its 1RM. Of course, this is the result of a regression and the graph clearly shows the diversity of profiles, even at the same weight, as well as a significant deviation around the mean.
As above, this graph and regression line also show that, on average, the heavier the athlete’s bodyweight, the heavier the athlete’s lift. However, one can clearly read that the pull-up is a much more difficult exercise! This was also expected but it is still nice to confirm it with data and back up our knowledge.
The regression line allows us to compute, given the bodyweight of a calisthenics practitioner, its expected 1RM in the pull-up exercise. This can constitute a first approximation of a fitness objective, but the practitioner should keep in mind the deviation around this expectation and that the dataset is built with athletes participating to a competition.
For me, whose weight is 72 kg, a reasonable 1RM computed from those data could therefore be around 54 kg. I do not currently train weighted pull-up but this is something that I should definitely be doing. A few month ago, I borrowed a weighted belt (the same day that I performed that weighted dip) and I barely sent a pull-up with an additional 20 kg. Still, I was happy as the pulling strength sure is my weakest one.
Once again, I am roughly halfway from being average ¯\_(ツ)_/¯.
Relative strength
The relative strength refers to the additional proportion of bodyweight an athlete can lift. It relates the amount of strength an athlete has compared to his or her bodyweight. As a last topic of investigation, we will try to answer this interesting question:
How does the relative strength depends on the athlete’s bodyweight?
In nature, insects have insane relative strength, children are quite strong, but how strong is the calisthenics adult?
I will link the results of this section with the level system that is introduced in the Overcoming Gravity book written by Steven Low. While the book is not open source, the author made the progression chart available online.
Dip
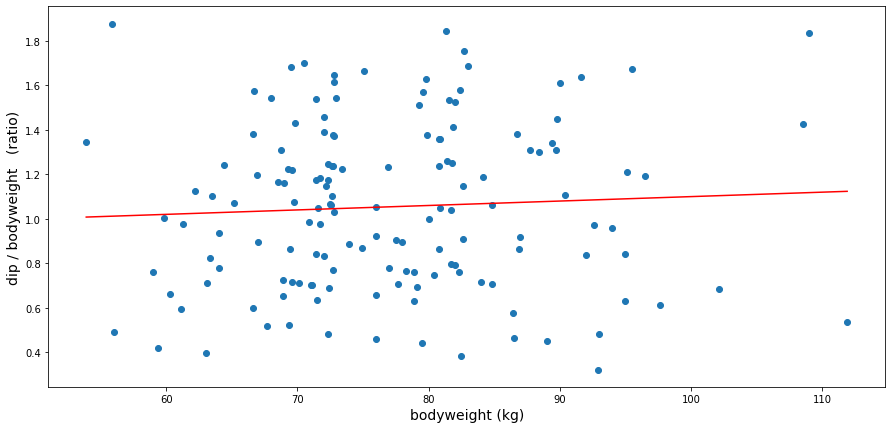
On average, for the dip exercise, a participant can add 105 % of its bodyweight, an impressive number. That is to say, a good calisthenics athlete is roughly at the level 9 of the progression chart of the Overcoming Gravity book.
From the graph, it seems like, for this pushing exercise, the heavier the athlete, the slighly better the relative strength. The regression line indicates a gain of 0.2 % bodyweight strength per kg of bodyweight: For each additional kg of bodyweight, an average (good) athlete can lift 0.2 % more of its own bodyweight.
Squat
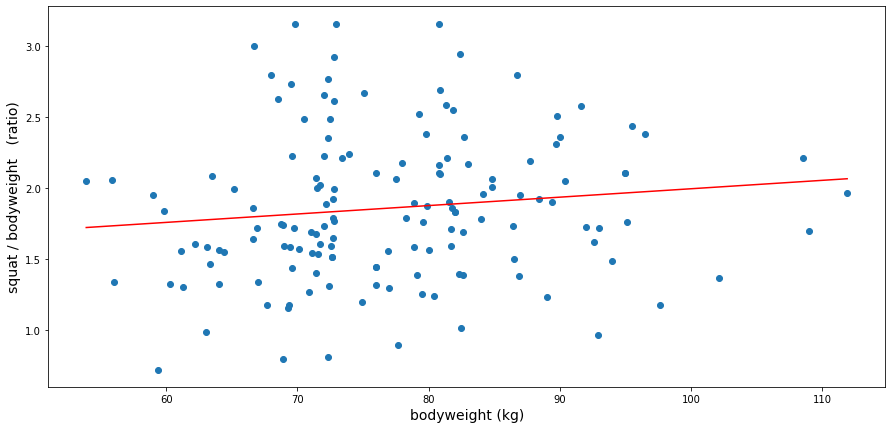
On average, for the squat exercise, a participant can add 186 % of its bodyweight, an impressive number. That is to say, a good calisthenics athlete is roughly at the level 9-10 of the progression chart of the Overcoming Gravity book (generalization from the weighted pistol squat).
From the graph, it seems like, for this pushing exercise, the heavier the athlete, the slighly better the relative strength. The regression line indicates a gain of 0.6 % bodyweight strength per kg of bodyweight: For each additional kg of bodyweight, an average (good) athlete can lift 0.6 % more of its own bodyweight.
pull-up
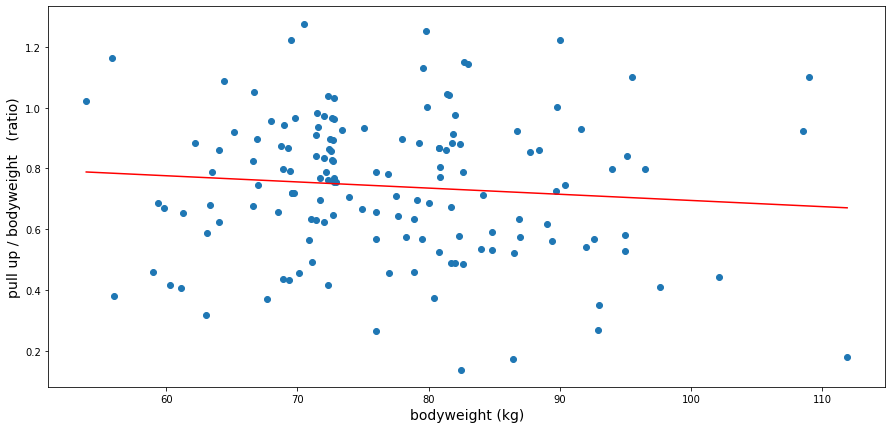
On average, for the pull-up exercise a participant can add 74 % of its bodyweight, an impressive number. That is to say, a good calisthenics athlete is slightly below the level 8 of the progression chart of the Overcoming Gravity book.
This is one good level below the two previous pushing exercises. It is interesting because it means one of the two things: the scale of the Overcoming Gravity book is slightly off, or the athletes are slightly lacking in the relative pulling strength. The two hypothesis are possible because Overcoming Gravity readers and the weighted calisthenics community are focusing on slightly different goals.
From the graph, it seems like, for this pulling exercise, the lighter the athlete, the slighly better the relative strength. The regression line indicates a loss of 0.2 % bodyweight strength per kg of bodyweight: For each additional kg of bodyweight, an average (good) athlete can lift 0.2 % less of its own bodyweight.
This wrap up our statistical analysis of the data from the King of Weighted Calisthenics competition.
What about me?
From what we computed above, one can see that from a weighted calisthenics standpoint, I am roughly half-average. However, considering that I truly started my calisthenics journey one year ago, I am happy that I progressed this far and I am thankful that I am still progressing. Thanks to this competition and this analysis, I have clear goals that I can aim at during the next few months, maybe years.
Side note: Regression lines are useful to compute predictions and extrapolate from the data. However, it is sometimes more interesting to use a subset of the data to compute more personalized quantities. The drawback is that since less data are used, the uncertainty of computed quantities is theoretically larger. In practice, it can give more precise predictions because we are generalizing from points that are more similar.
I am 1.8 m. From the collected data, the subset of athletes with this height have the following average numbers (OG: Overcoming Gravity):
| bodyweight | dip | pull-up | squat | |
|---|---|---|---|---|
| Absolute weights (kg) | 78 | 89 | 66 | 144 |
| Relative weights (%) | 100 | 114 | 85 | 185 |
| OG level | level 10 | level 9 | level 10 |
Those are quite challenging goals for me to have - but what’s the point of a goal if it is not challenging for a bit!
It also show that the Overcoming Gravity scale is quite a good and interesting one. Indeed, level 9-10 is the transition from intermediate to advanced athlete according to the book. It is reasonable to think that the average participant of the King of Weighted calisthenics competition is on the verge of being an advanced athlete and that the top percernts can be considerd closed to (if not) elite athletes.
It is interesting to compare the above values to the previously computed one (from the regression). We report the previously computed values below for ease of comparison.
| bodyweight | dip | pull-up | squat | |
|---|---|---|---|---|
| Absolute weights (kg) | 81 | 75 | 54 | 132 |
| Relative weights (%) | 100 | 93 | 67 | 163 |
| OG level | level 8-9 | level 7 | level 9 |
That is say, considering only the relevant subset of participants, my new target weight is lighter but my target lifts are heavier…
Wonderful!
What I prefer about the numbers computed from the subset of athletes that are 1.8 meter tall is that they correspond to a greater relative strength.
With that, we will close this post. Thank you very much for reading up to this point! If you have any remark or question, feel free to reach me, my door is always open!